


Views on HDFC Bank
Are Merger pangs giving an opportunity to buy?

This is the first time in my investing career (since 2008) that I am witnessing the market’s wrath for HDFC Bank. With this article, I try to understand what, why, and the way forward for the bank and its stock price.
Please note that this is not a buy or sell recommendation for the stock. I have used some banking-related terms here which are assumed to be well understood by the reader. HDFCB is used as an abbreviation for HDFC Bank and HDFC for HDFC Ltd (now merged with HDFCB).
The what:
In the past one week, HDFCB has registered the highest-ever selling volumes. Many FIIs have dumped the stock even though the bank’s stock price has been the worst-performing stock in the last one year and its P/b is lower than the last 10 years average.
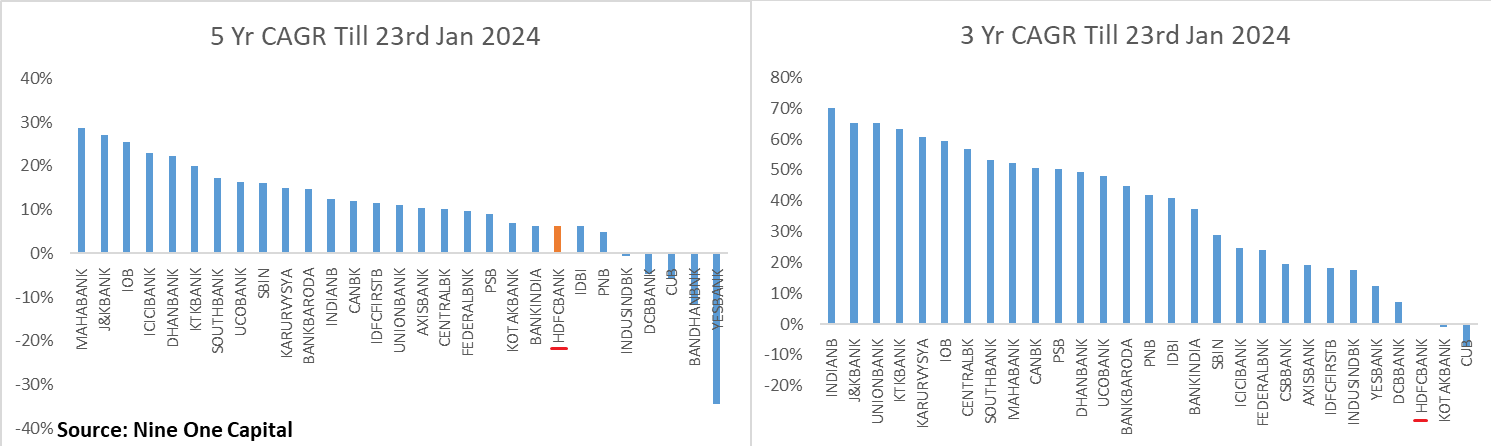
The bank has been underperforming the other banks (in terms of stock price performance) for quite a while – over a 5-year and 3-year basis, HDFCB’s stock price performance is in the bottom quartile as shown below. However, the latest blow to the stock price was triggered by the bank’s Q3 results which the bank disclosed last week on 16 Jan 2024. Let’s try to understand what happened in the Q3 FY24 results which is spooking its investors.
The Why:
There must be something terrible that must have happened in its Q3 results that has unnerved the institutional investors. Q3 FY24 was the second such quarter where the bank reported the merged entity numbers. Here is the quick YoY snapshot for the same with relevant metrics:
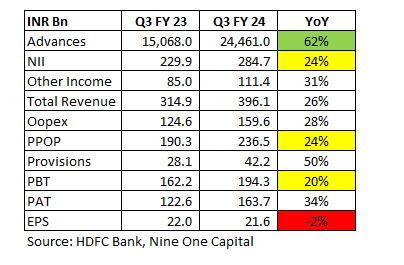
The above results are not like to like since in the base quarter the numbers were reported for the non-merged entity. However, I have shown them to make a few inferences. On a YoY basis, the advances growth is 62% (due to HDFC being merged into the bank) while the Net Interest Income growth has only 24% reflecting the reduced NIMs for the merged entity as shown in the bank’s presentation:
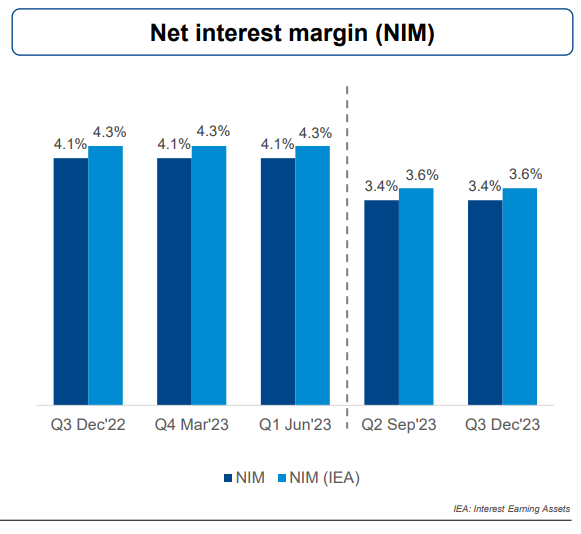
The reason for this reduced NIM is the drastic change in the composition on the liabilities side of the balance sheet. Here is how it has changed post the merger:
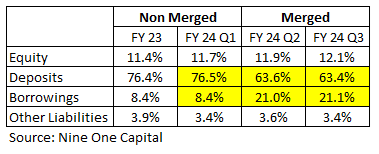
As shown above, deposits (which attract lower costs) have shrunk at the cost of borrowings (higher costs) since HDFC’s retail deposits were only 19% of its liabilities Vs HDFCB’s around 76% before the merger. Refer to the image below to see how the cost of funds has changed post the merger:
Access to lower cost of funds was the most important synergy benefit mentioned as the rationale for this merger. However, with an overall liquidity shortage in the system, virtually all banks have been showing lower deposit growth Vs the advances growth. CASA growth is even lower than deposit growth. This makes it tough for HDFCB to replace this higher-cost borrowings with lower-cost deposits as anticipated at the time of the merger. Let’s see its impact on the bank’s ROE tree:
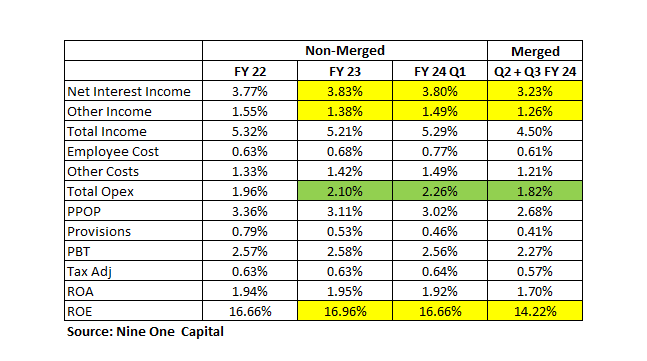
The ROAs have dropped to ~1.70% from ~1.95% and have led to lower ROEs at 14%. Now the street is having doubts about HDFCB’s ability to replace high-cost borrowings with low-cost deposits which will make these supposedly ‘temporary lower ROEs’ to ‘Structural lower ROEs’. Lower ROE means lower profitability on the invested capital and hence lower valuation multiples. Further, the bank has to decide whether it wants to slow down on lending (impacting advances growth) or do lending at a lower margin. Considering the low liquidity environment, most probably it will be a slowdown in lending and hence the performance of current stock price that we are witnessing.
Way forward:
Now we don’t know whether the bank will be able to raise these low-cost deposits and will be able to bring back its NIMs to the previous high levels and achieve those previous higher ROEs. What we can do is evaluate what it means for the bank if the current situation doesn’t improve and remains at the current levels or if it improves to go back to where HDFCB was before the merger.
Let’s try to visualize the scenario for FY 26 under different assumptions as shown below. In the bull case, we assume that the NIMs go back to where they were before the merger with merger benefits at the Opex level while in the bearmost case, we assume NIMs to remain structurally low but Opex related benefits to be there. We assume different growth rates under these scenarios to account for various unknowns.
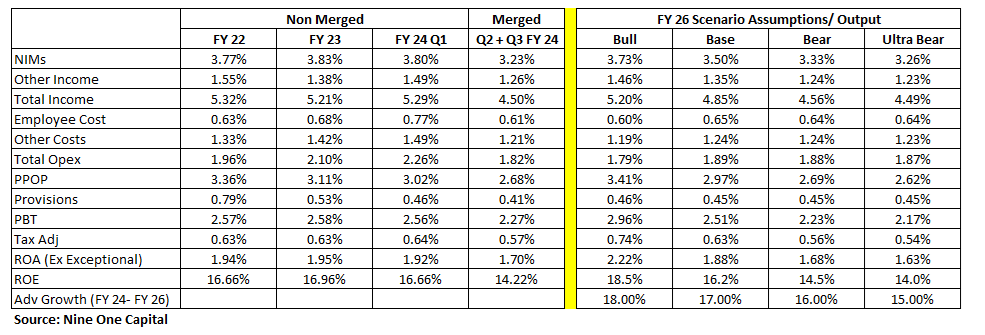
As shown, if the current situation prevails, HDFCB’s ROEs can significantly be lower at 14% vs the historical 17%. This is a big implication.
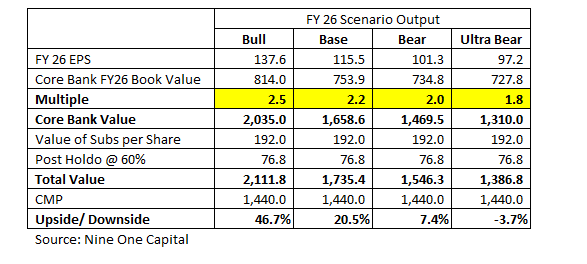
Below are the EPS and Book Value that we get under the above-noted assumptions for various scenarios. The multiples I have given are fair considering the size and track record that the bank has built over the years. You can of course give lower or higher multiples to see how the calculations stack up for yourself.
Conclusion:
As shown above, even in the bearmost case, there doesn’t seem to be much downside if one buys HDFCB at current market prices. However if the bank can change the situation for the better and as envisaged, the current stock price can potentially turn out to be a great price to invest in HDFCB for a 3-4 year view. Markets re-rate these stories very quickly and the bank can again command a premium valuation multiples of above 3 also in that scenario.